
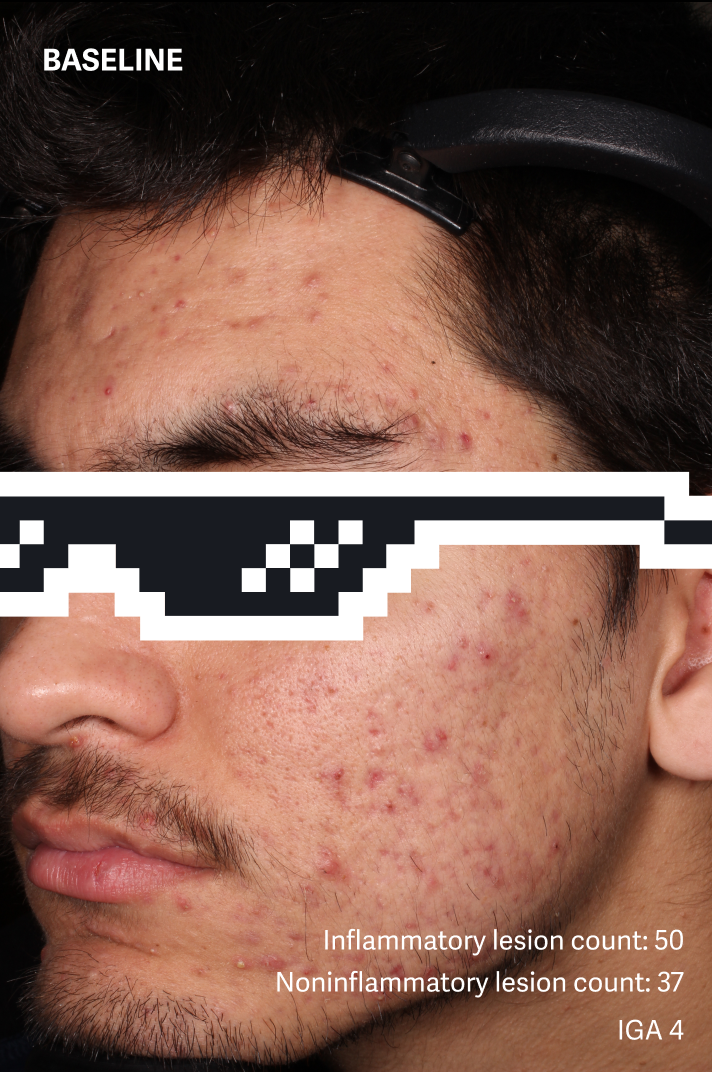
Potent doses for rapid results
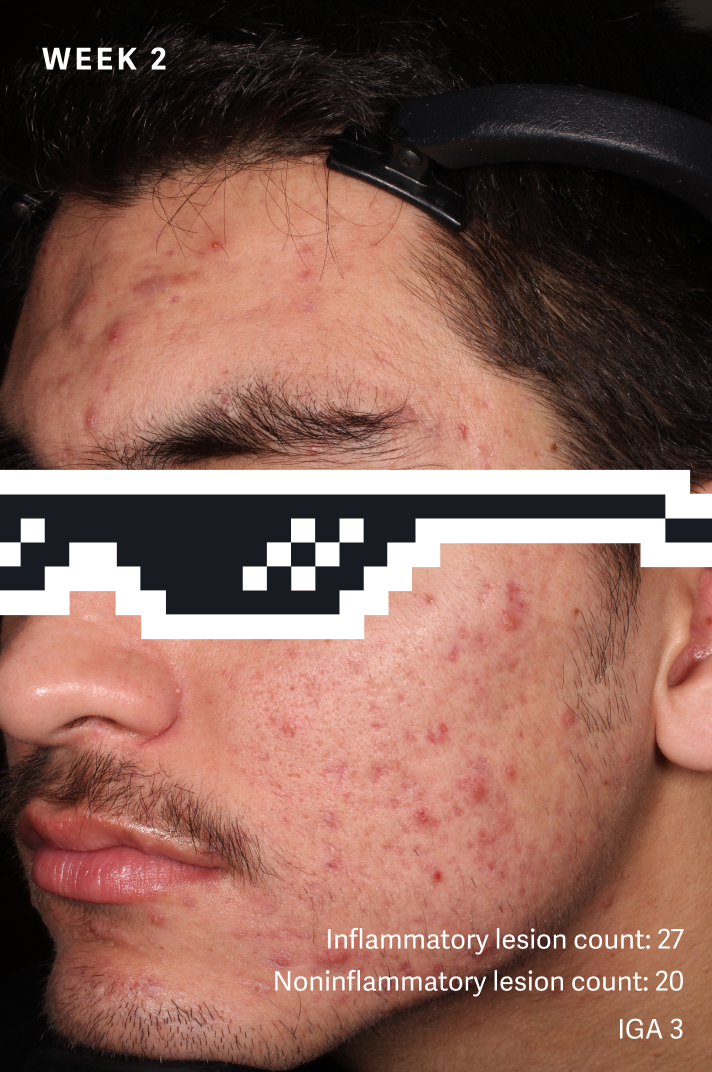
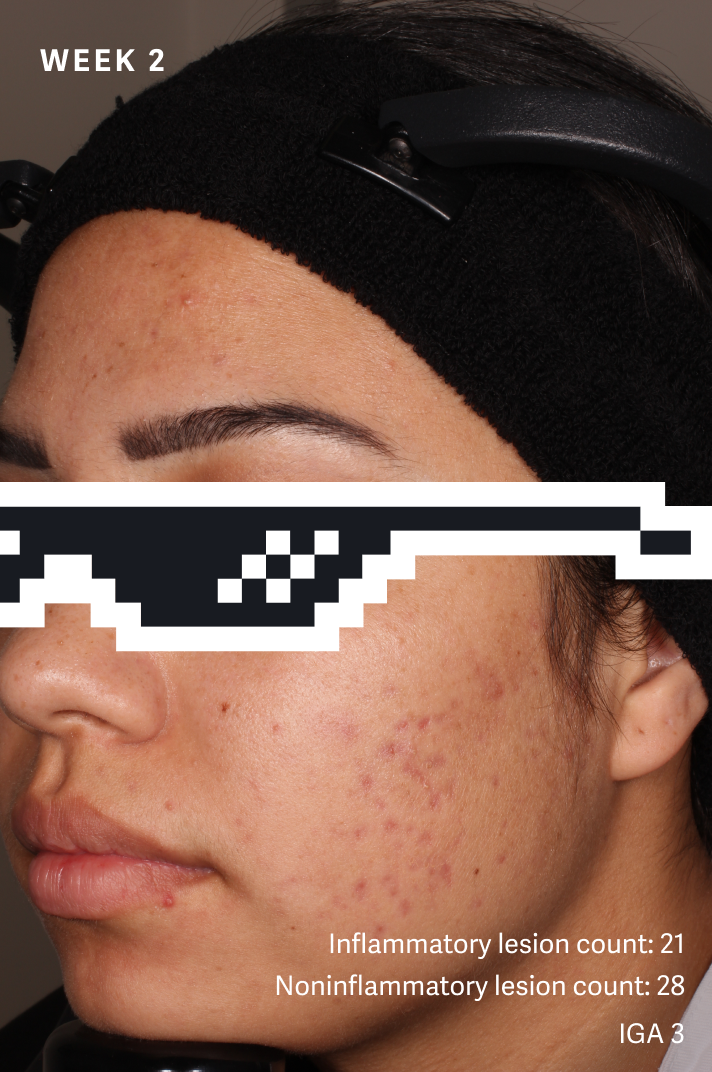
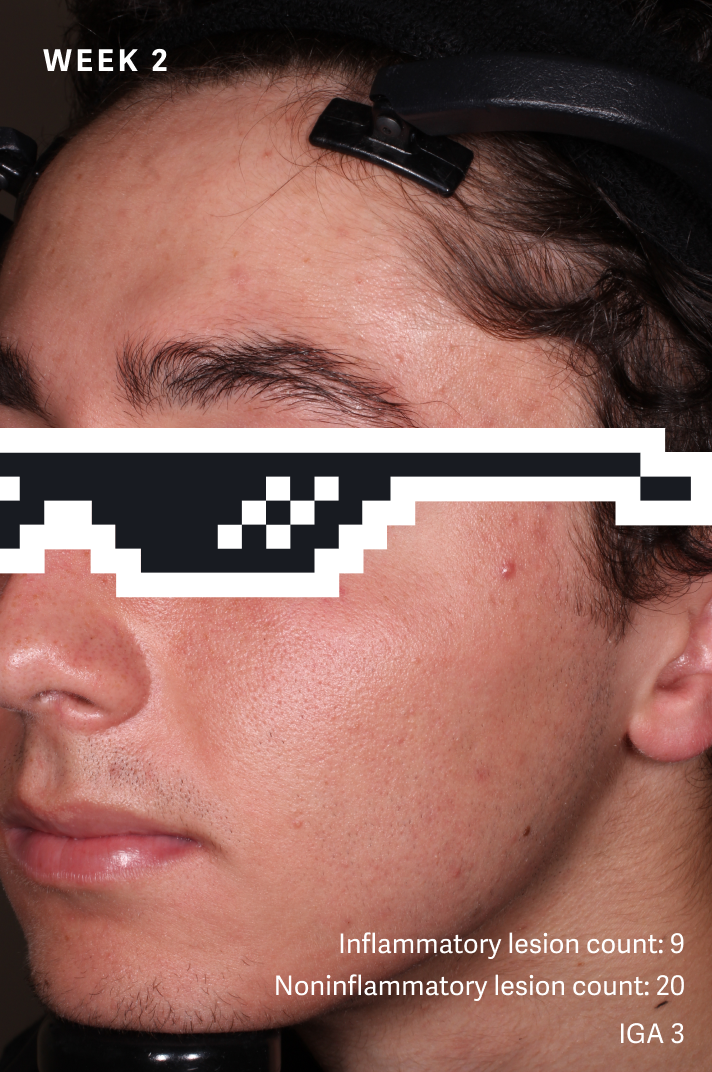
Discover a visible difference as early as Week 21,2*
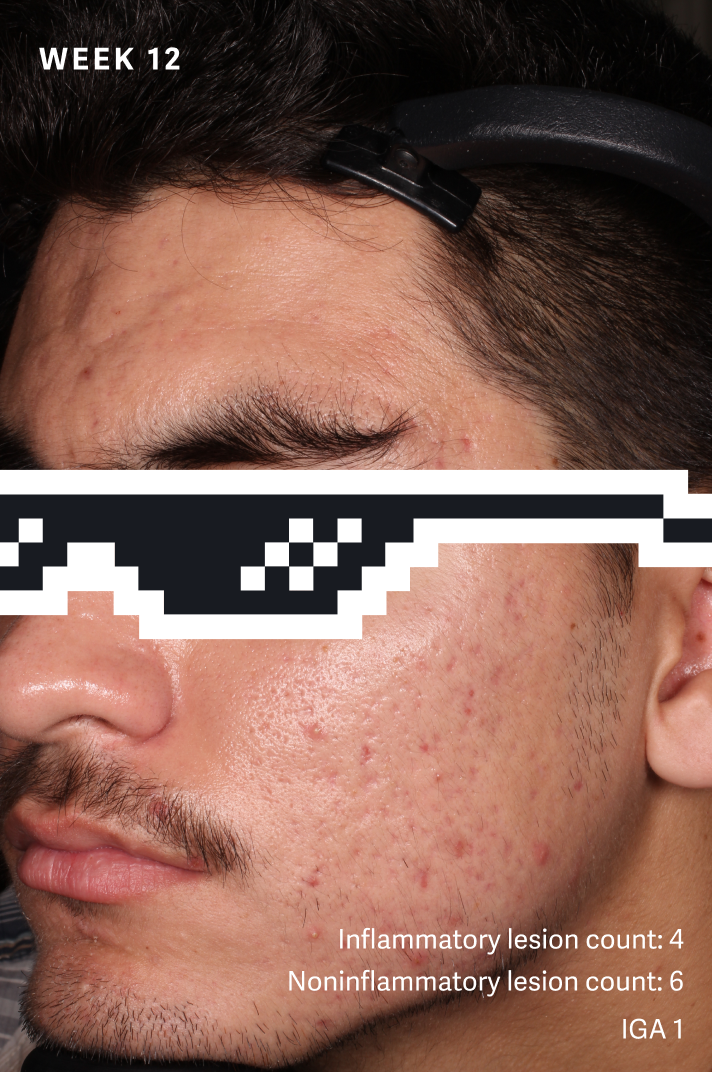
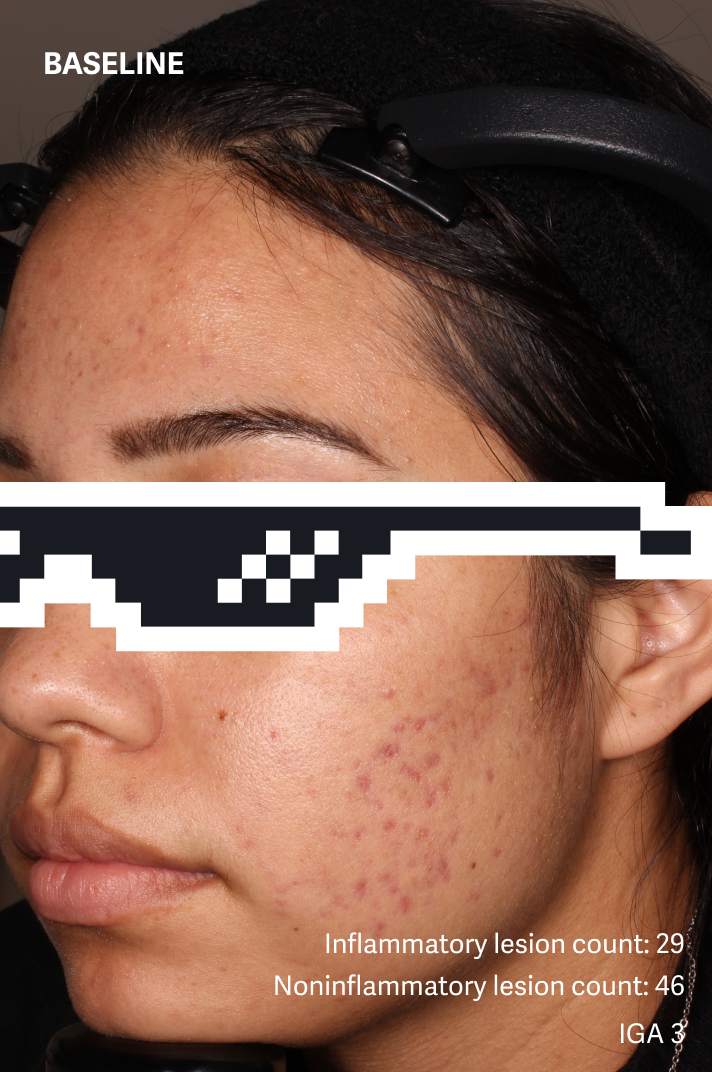
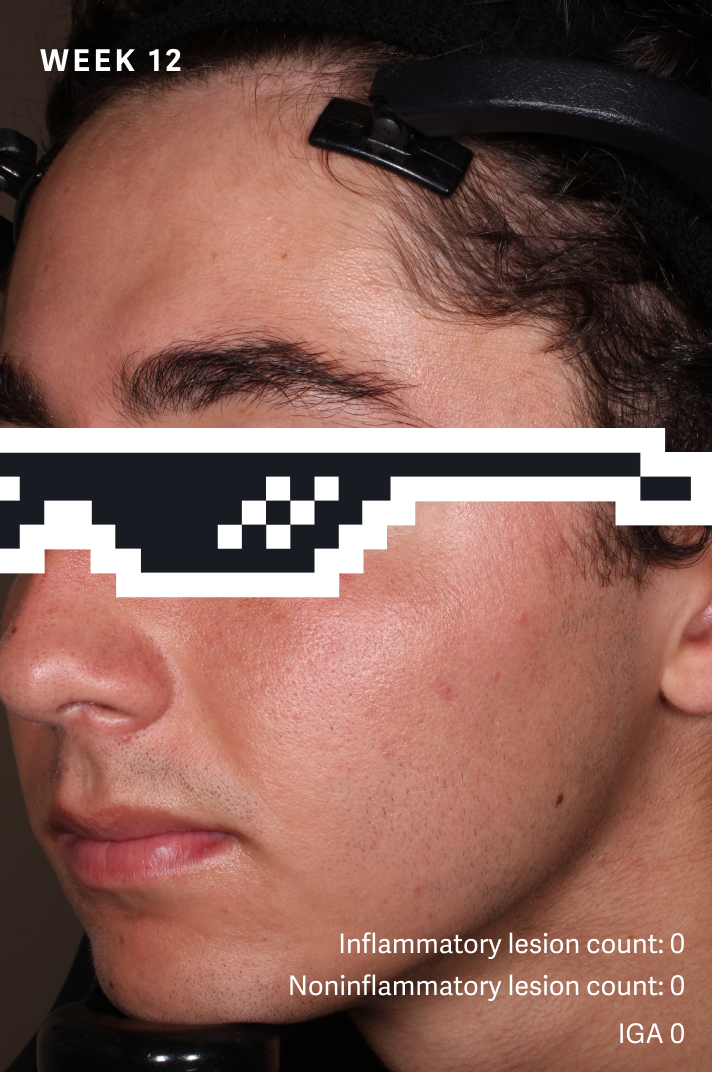
Success
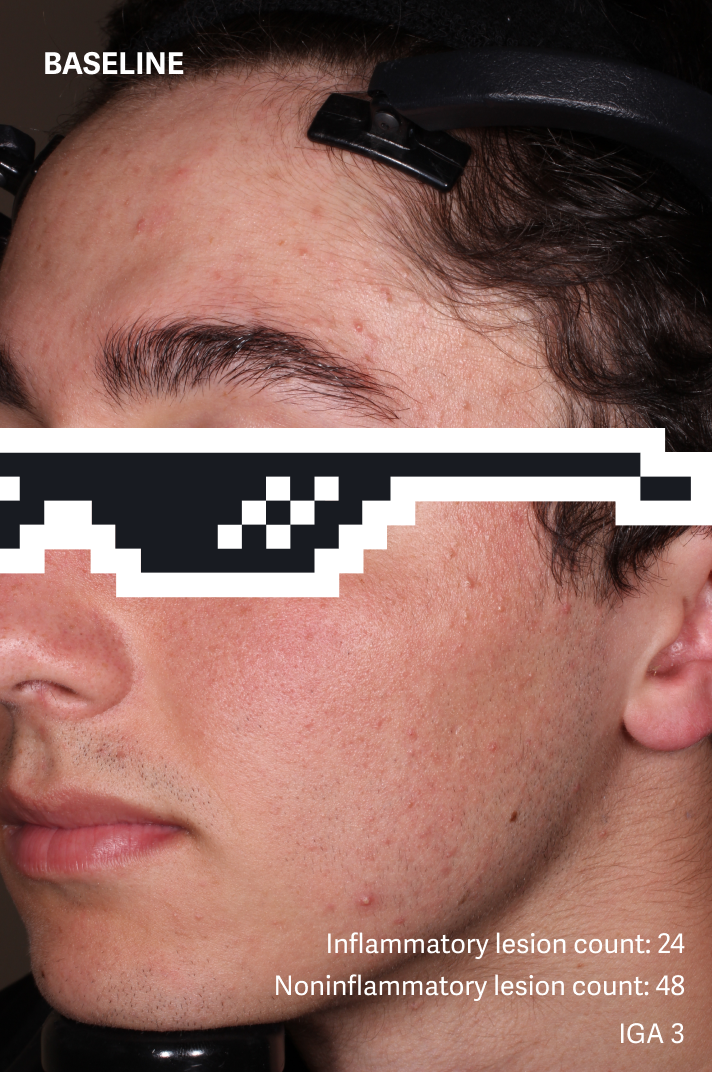
Male
Failure
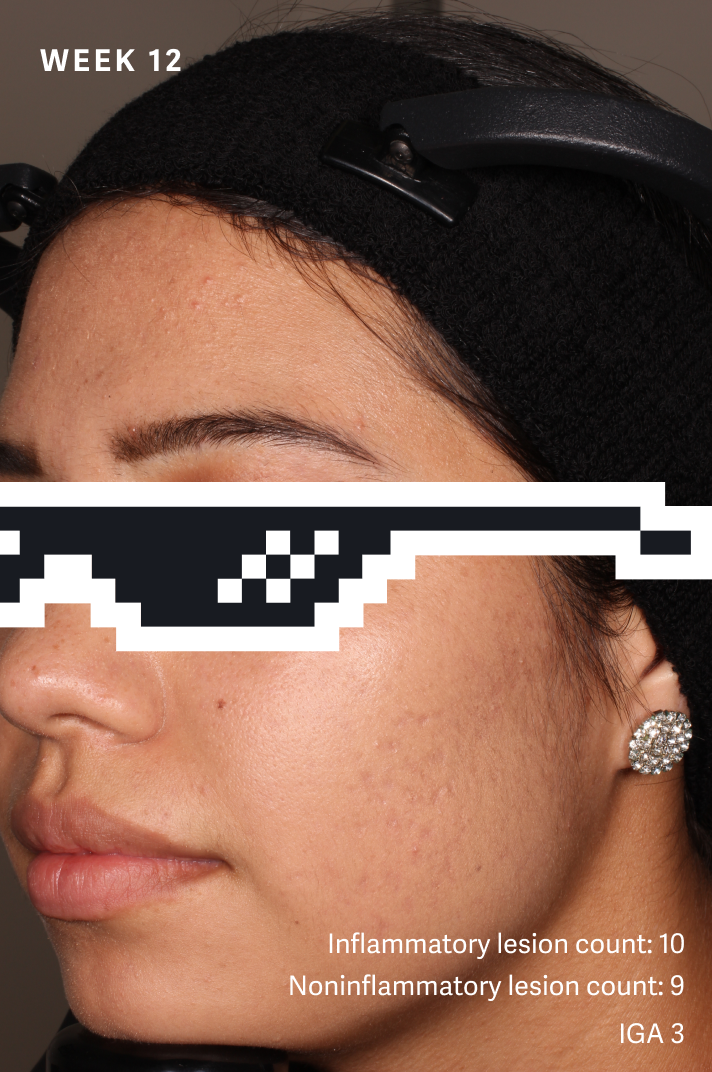
Female
Success
Male
Failure
Female
Study SGT-65-04SGT-65-05: double-blind, randomized, vehicle-controlled safety and efficacy 12-week study of tretinoin, (0.1%) and benzoyl peroxide, (3%) vs vehicle cream.3
See Full Study Design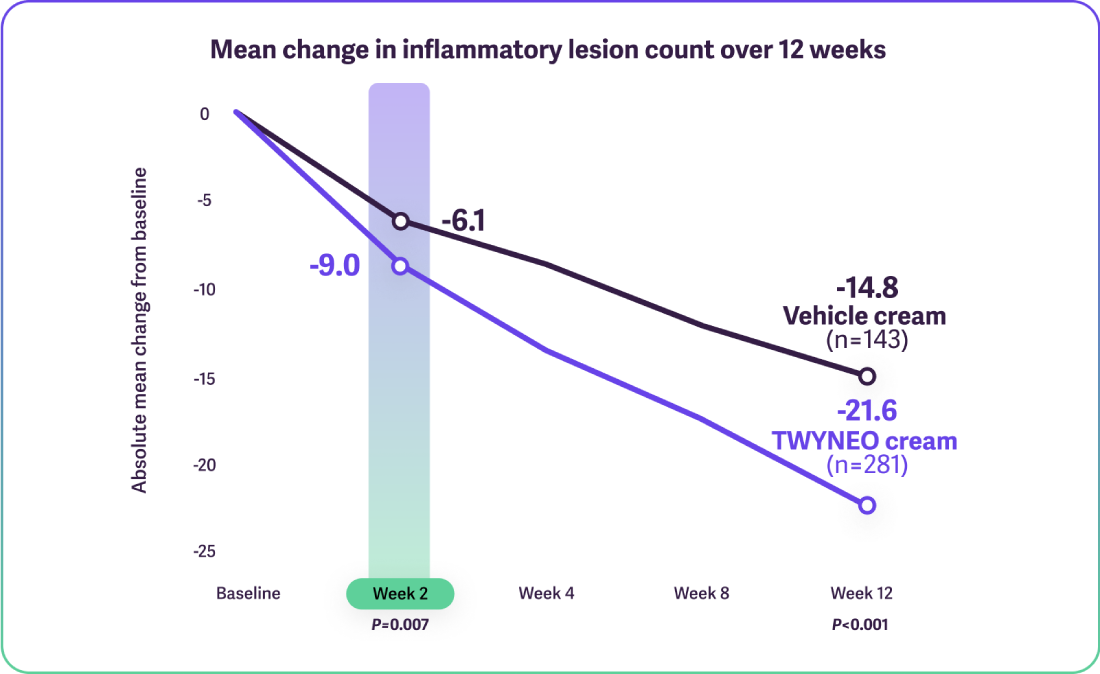
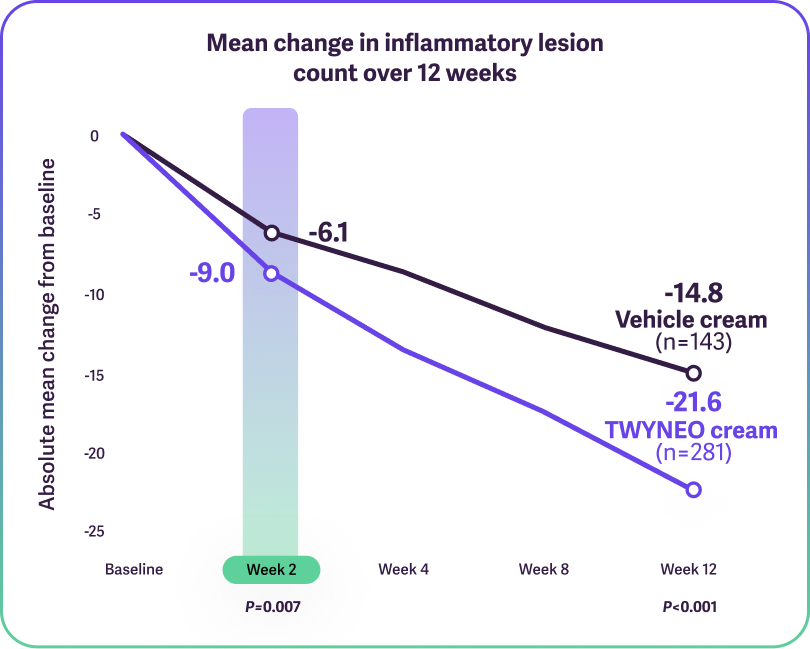
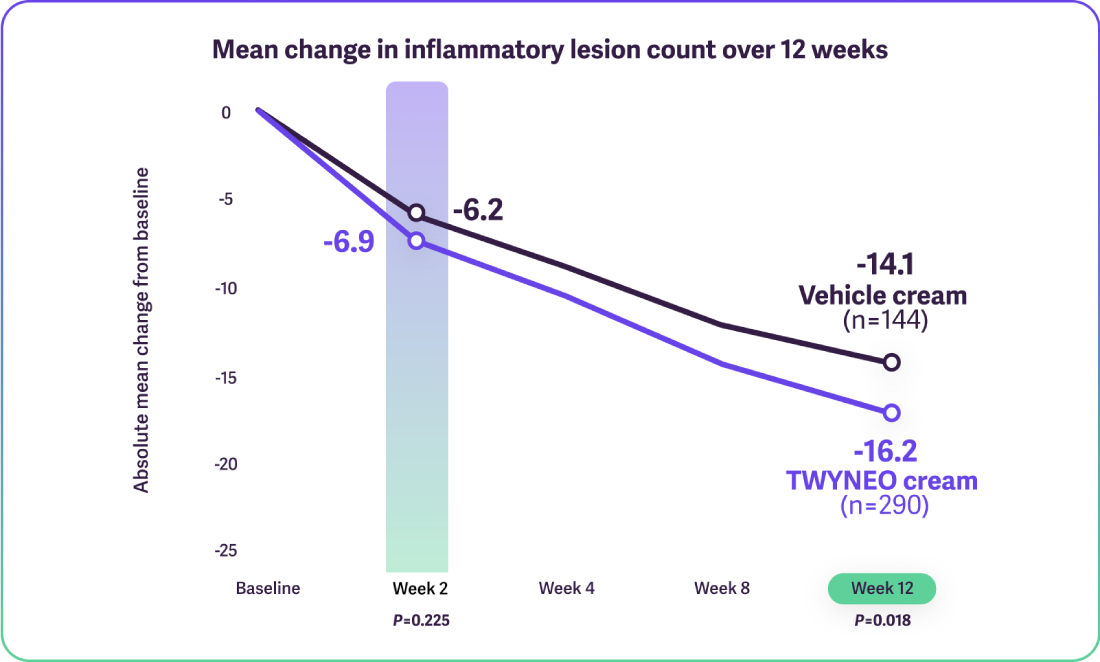
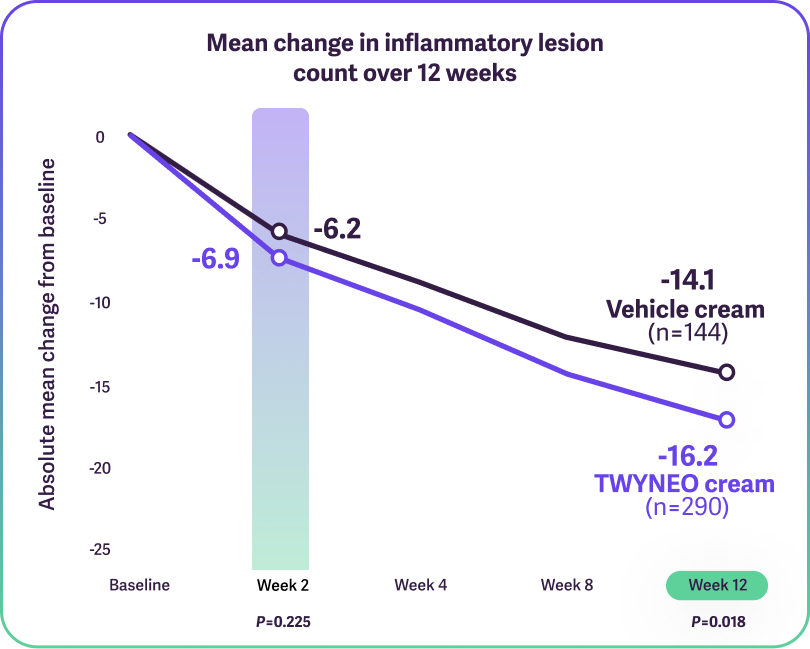
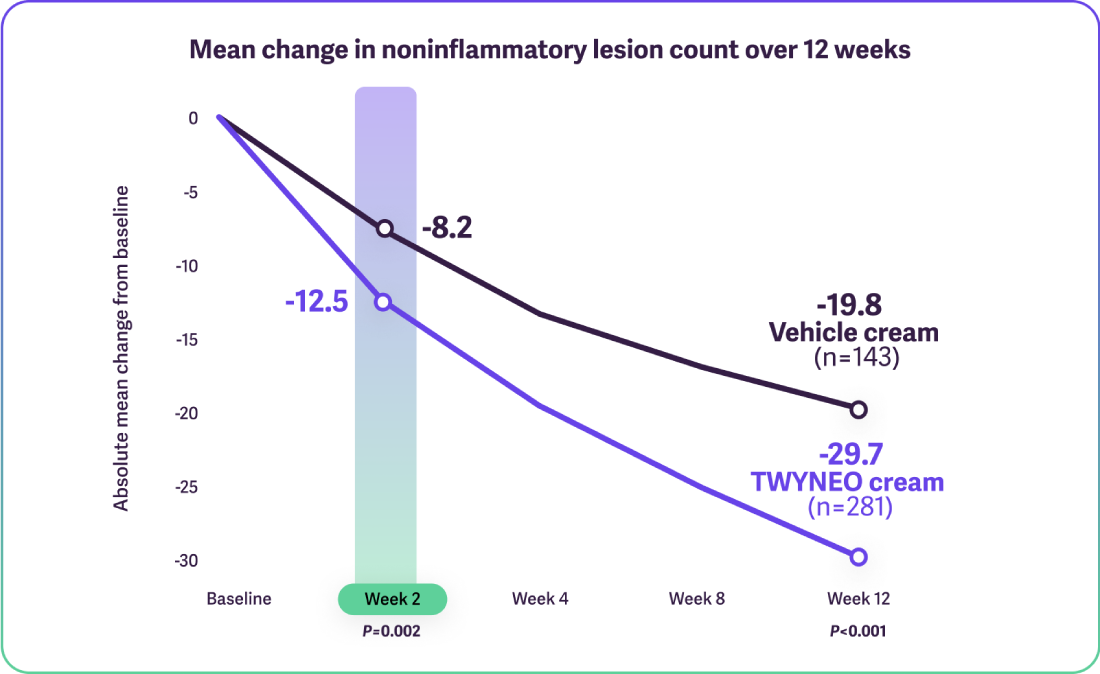
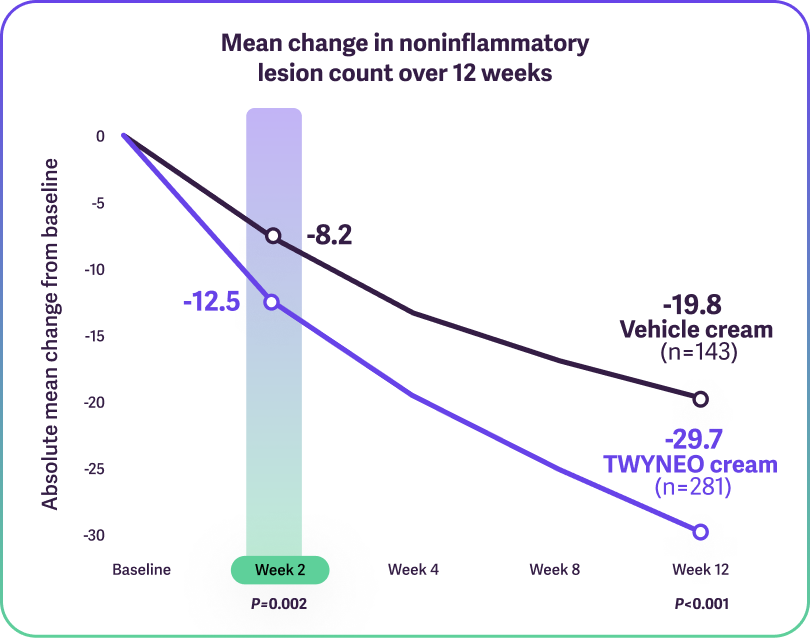
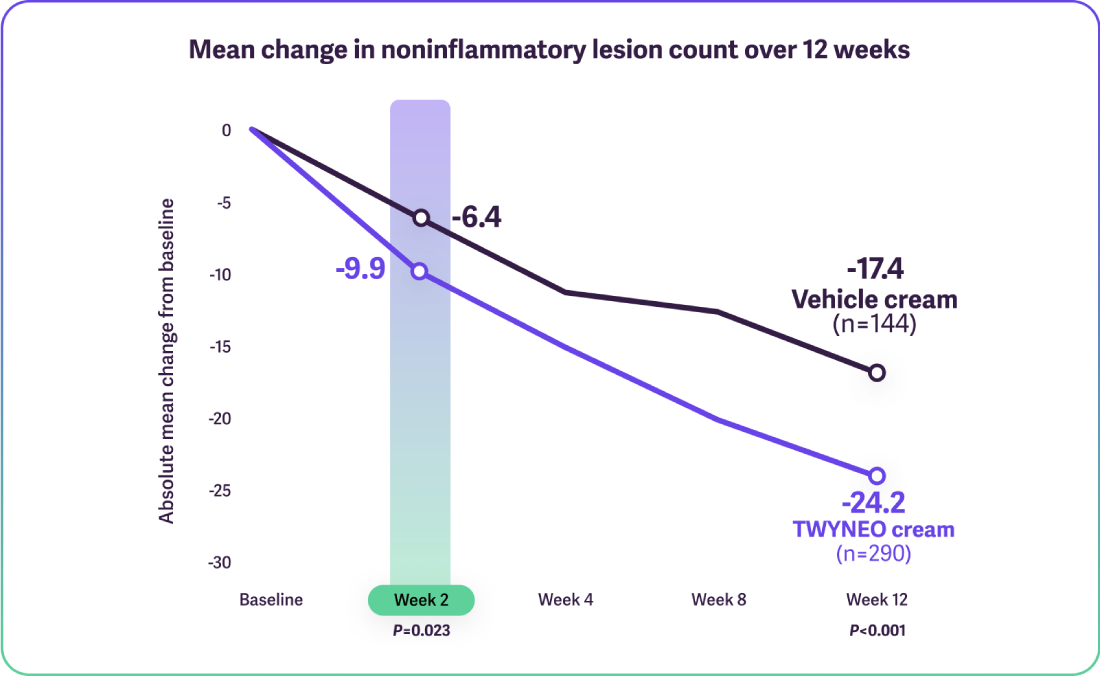
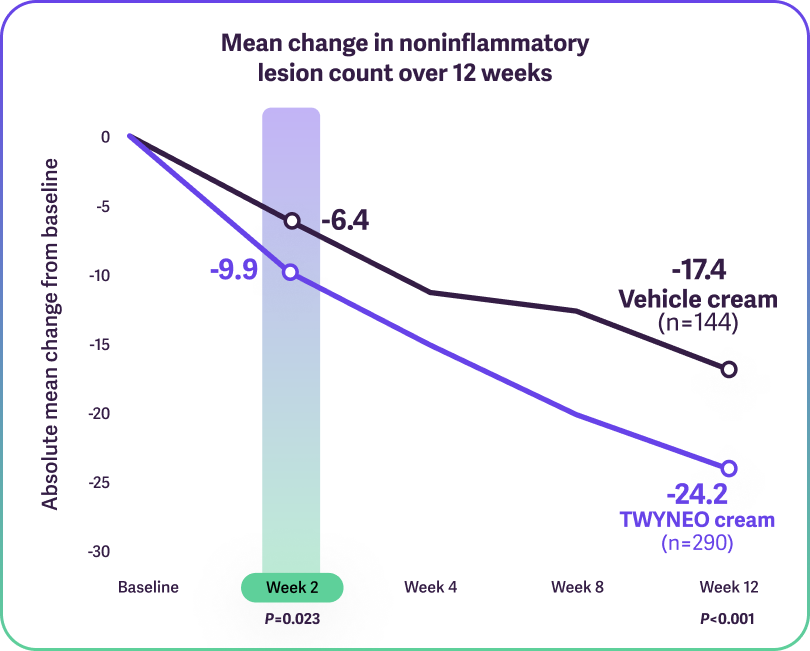
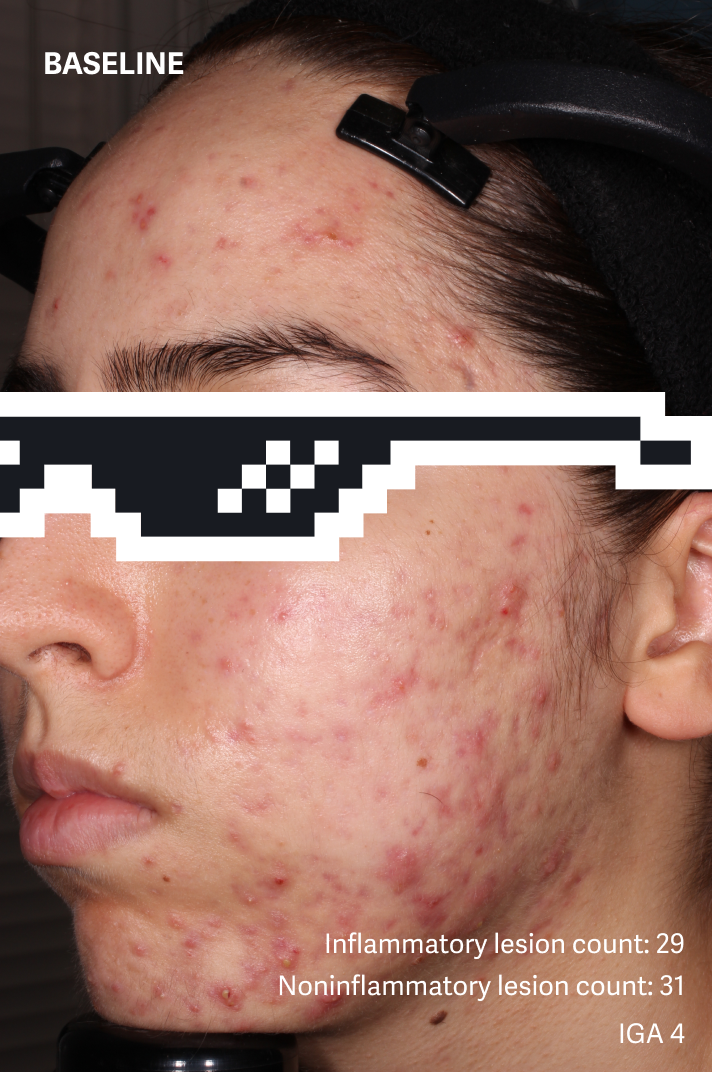
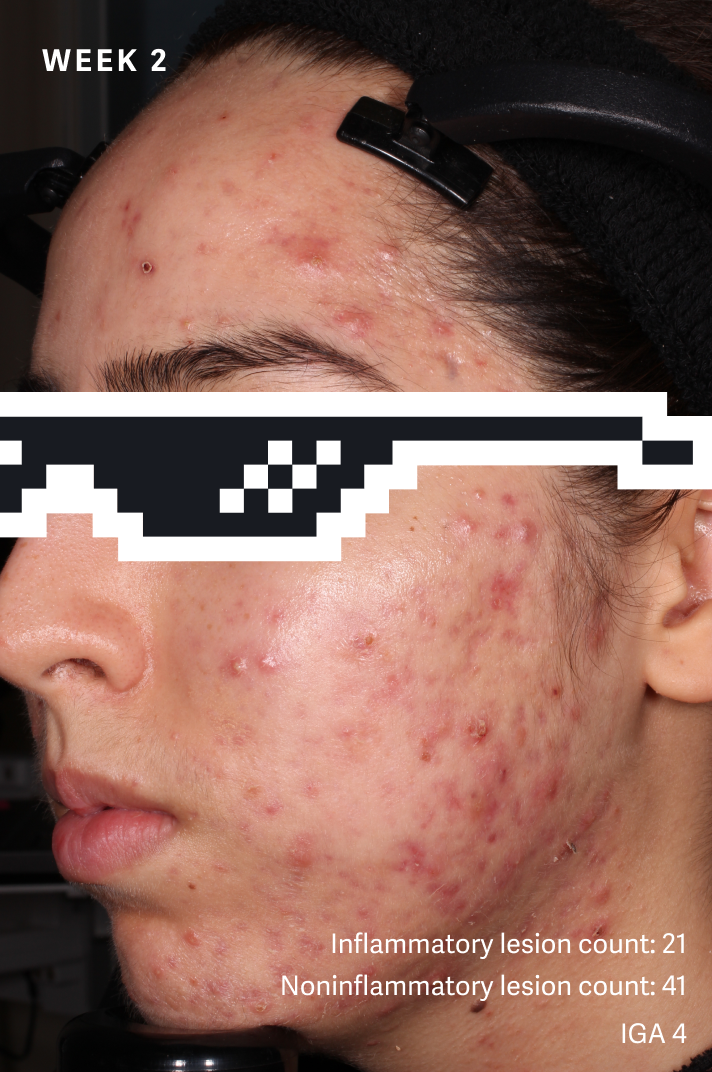
Noninflammatory lesion reduction at Week 2.1,2
Multiple imputation (MCMC) used to impute missing values. Percent at Week 2 represents values obtained from averaging the summary statistics generated from each imputed data set.1,2
Percent change analysis was conducted separately from analysis of absolute change.1,2
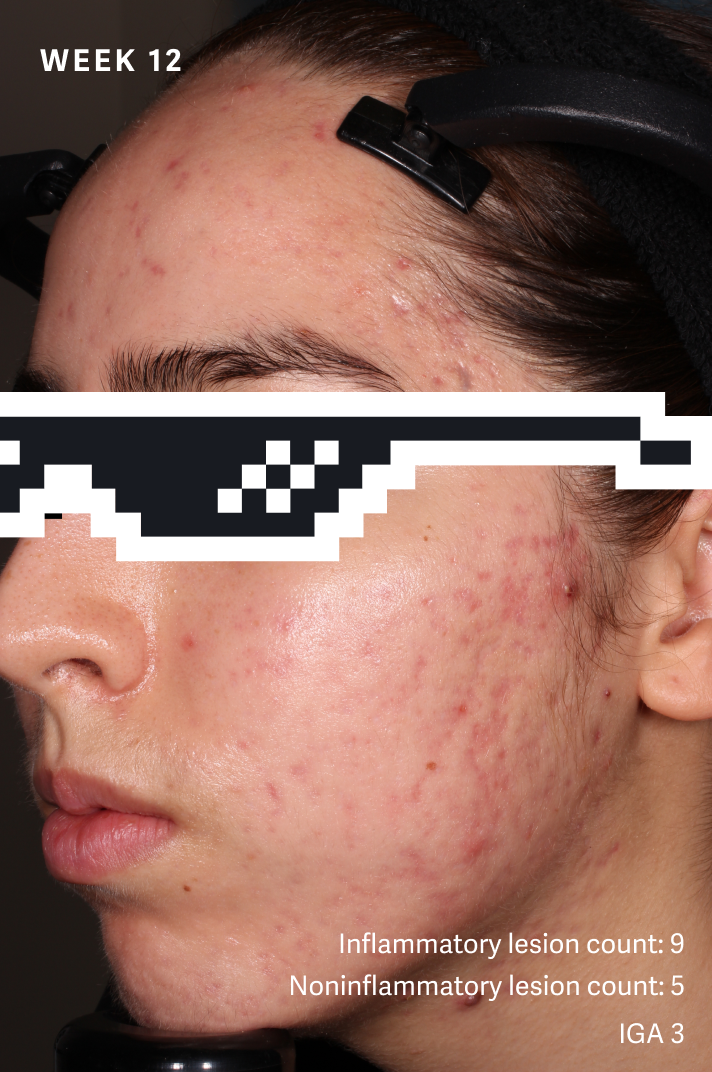
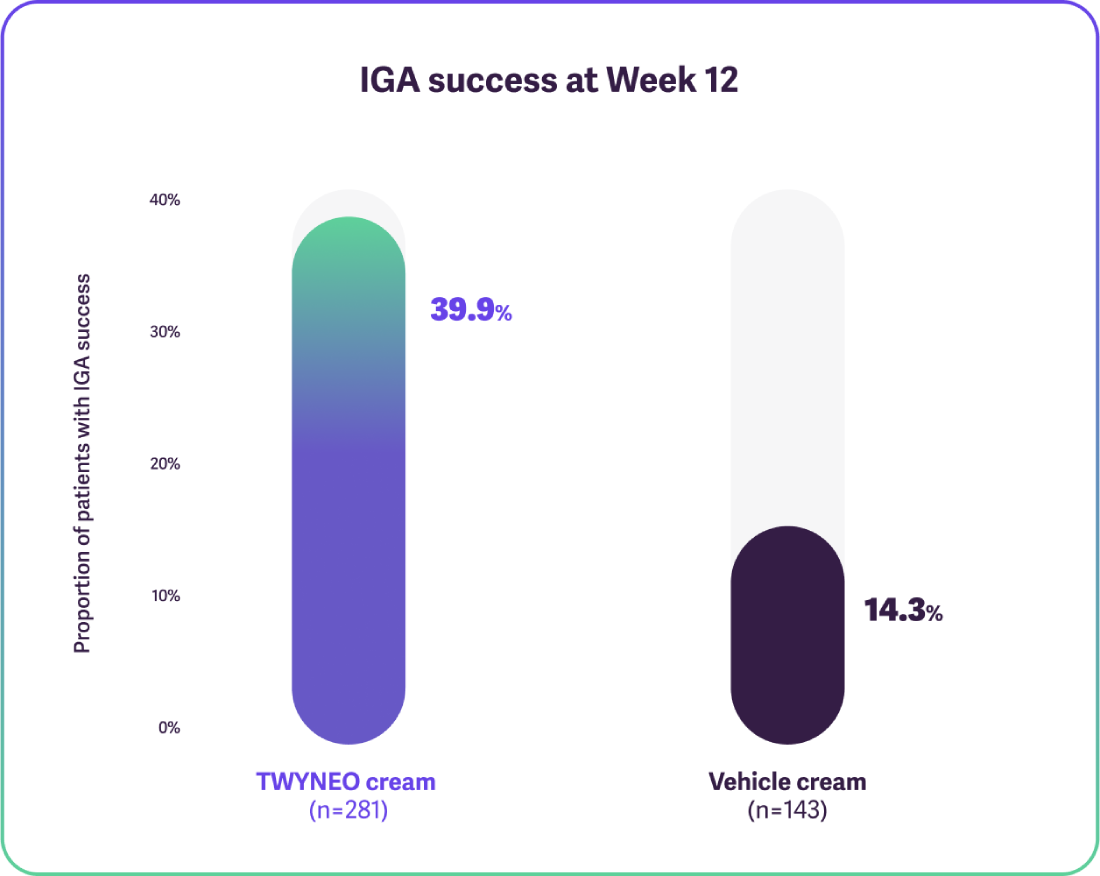
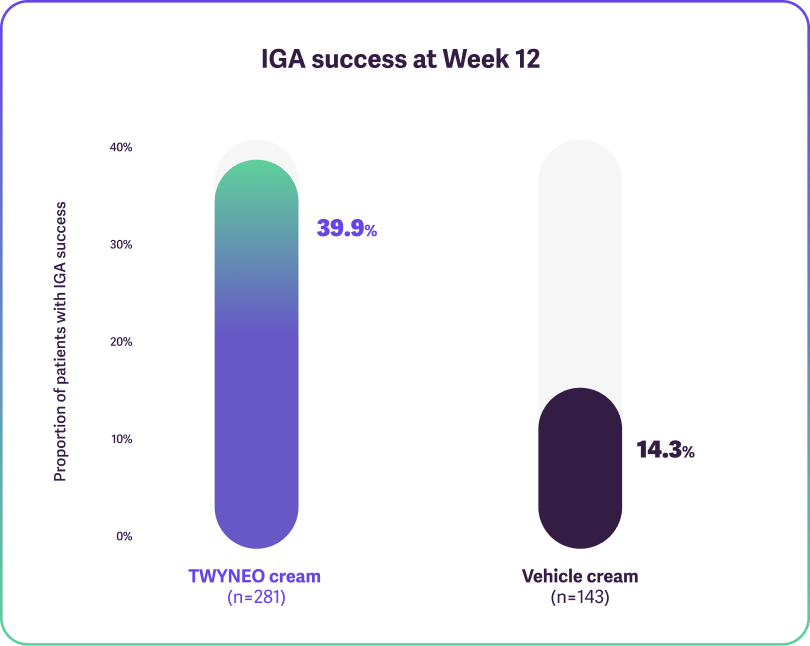
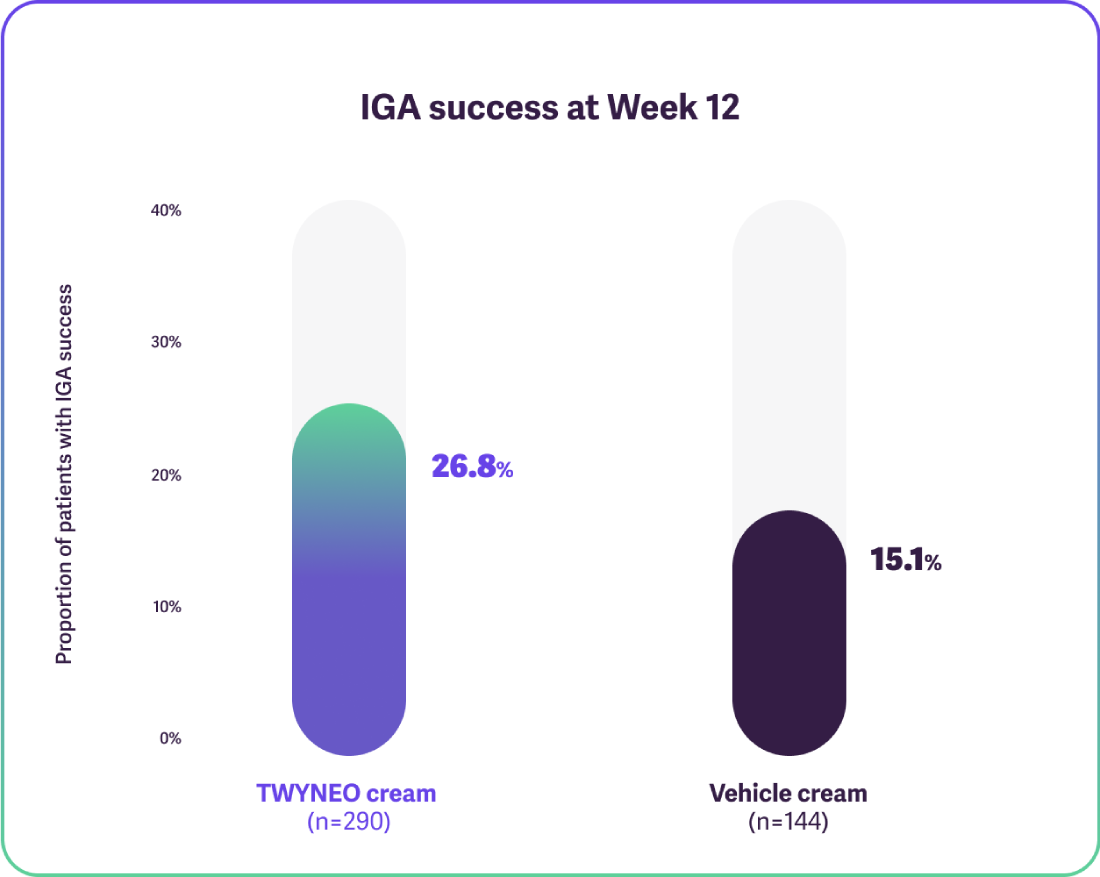
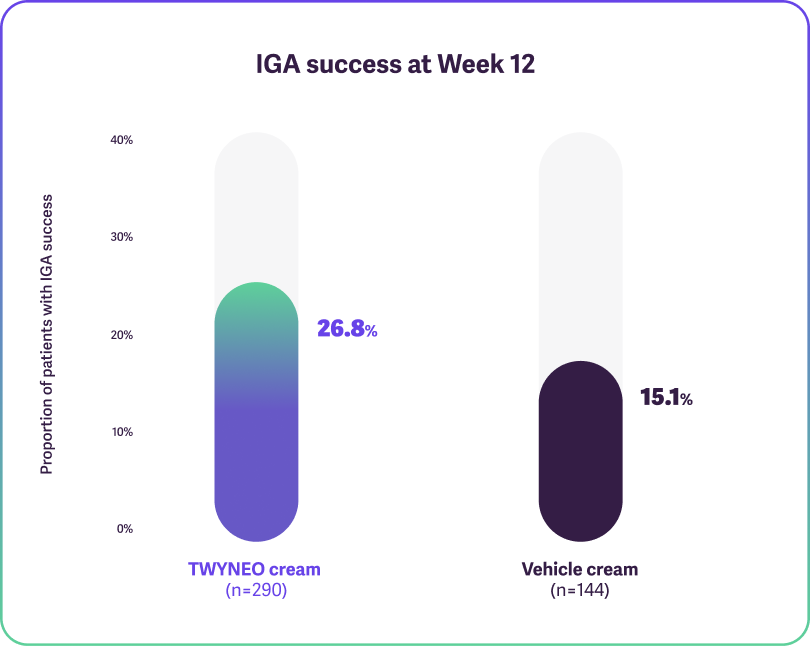
IGA (Investigator Global Assessment) success was defined as an IGA score of 0 (clear) or 1 (almost clear) and at least a 2-grade improvement (decrease) from baseline at Week 12.3
Above results based on MI analysis. In Study SGT-65-04, 38.5% of subjects treated with E-BPO/T achieved IGA success vs 11.5% for vehicle (P<0.001).1
Above results based on MI analysis. In Study SGT-65-05, 25.4% of subjects treated with E-BPO/T achieved IGA success vs 14.7% for vehicle (P=0.017).2
Multiple imputation (MCMC) used to impute missing values.1,2
References: 1. Mayne Pharma; data on file. Clinical Study Report SGT-65-04; May 28, 2020. 2. Mayne Pharma; data on file. Clinical Study Report SGT-65-05; June 5, 2020. 3. TWYNEO (tretinoin and benzoyl peroxide) cream, 0.1%/3% [Prescribing Information]. Fort Worth, TX: Mayne Pharma; July 2021.